Utility-Scale Battery Storage: Where the Revenue Comes From
Oct 24, 2025
Most utility-scale battery capacity in the United States now earns its largest single share of revenue from energy arbitrage: charging when wholesale prices are low, usually in the middle of the day when solar output is heaviest, and discharging into the evening peak. The U.S. Energy Information Administration put arbitrage ahead of frequency regulation as the most common primary use reported by operators for 2024.
That headline is accurate and also misleading, in a way that matters to anyone underwriting a project. Arbitrage is the biggest line because it is the biggest legacy line. It is barely growing: the 10.2 GW added in 2024 went almost entirely to other uses, and revenue per kilowatt fell sharply in both large markets. What follows is what each stream actually pays, and why the mix is shifting.
What the EIA Data Actually Shows
Since the 2023 survey, the EIA has asked operators of storage facilities of 1 MW or larger to name the primary use of each battery, not just the list of services it can provide. That change is what makes a revenue conversation possible at all. Older data told you a battery did four things; it never told you which one the business case rested on.
The 2024 answers, published in September 2025, are the basis for most of what follows. The underlying figures sit in File 3.4 of the Annual Electric Generator Report.
Metric
End of 2023
End of 2024
Total utility-scale battery capacity
15.8 GW
About 26 GW
Capacity with arbitrage among its uses
Not separately published
66%, or about 17 GW
Capacity primarily used for arbitrage
10.5 GW, or 66%
41%, or about 10.7 GW
Capacity primarily used for frequency regulation
Not separately published
24%, or about 6.2 GW
Read the third row twice. Capacity primarily used for arbitrage went from 10,487 MW at the end of 2023 to roughly 10.7 GW at the end of 2024. The fleet grew by 10.2 GW. The arbitrage share of it grew by about 0.2 GW.
In other words, less than 2% of everything built in 2024 was built to arbitrage power. The other 98% reports some other primary use: frequency regulation, renewable firming, peak shaving, co-located support or capacity adequacy. Arbitrage keeps the crown on a technicality: it is still the single largest category in a much larger fleet.
The fleet grew by 10.2 GW in 2024. Capacity primarily used for arbitrage grew by about 0.2 GW.
Energy Arbitrage: The Biggest Line, No Longer Growing
Arbitrage revenue is the difference between the price paid to charge and the price received to discharge, less efficiency losses. A 100 MW / 400 MWh system cycling once a day moves 400 MWh in and about 340 MWh out at 85% round-trip efficiency. At a captured spread of $60/MWh that is roughly $20,400 a day gross, before the cost of the energy bought is netted out.
The spread is the whole business. In California solar shapes it: midday prices collapse when utility PV output peaks, then the evening ramp sends them back up. A 2025 Berkeley study of storage revenue models measured a third-quarter 2024 arbitrage spread of $75/MWh in CAISO, against $23/MWh in Guangdong over the same months. On 7 October 2024, the CAISO battery fleet hit a record 8.4 GW of simultaneous discharge as NP15 real-time prices cleared above $1,200/MWh during the evening ramp.
How a cycle is priced
Three variables decide whether a cycle is worth running: the spread, the efficiency, and the degradation cost of the cycle itself. A $60 spread on an 85% efficient system leaves about $51 of gross margin per MWh charged. Against a cycle cost of $5 to $15/MWh for a lithium iron phosphate system over its warranted life, that is clearly worth running. At a $25 spread the margin falls to about $21, close enough to the degradation cost that operators start sitting out.
What erodes the spread
Batteries erode their own spread. Every additional gigawatt that charges at noon and discharges at 6 p.m. flattens the noon trough and shaves the evening peak. McKinsey's 2025 analysis of US battery operator economics attributes at least 30% of the revenue decline in US storage markets since 2023 to this cannibalization effect rather than to weather or fuel prices.
The practical response is dispatch optimization: bidding energy, reserves and regulation into the same hours, and letting software decide when a cycle is worth its degradation cost rather than running a fixed daily pattern.
Frequency Regulation and Ancillary Services
Frequency regulation pays for capacity held ready to move within seconds, not for energy delivered. It was the most common use case in the US for years, and it is still the primary use for about 24% of utility-scale battery capacity, or roughly 6.2 GW. Payment is usually a clearing price per MW per hour of availability, plus a mileage or performance component that rewards fast, accurate response.
The ERCOT collapse
Texas is the clearest case study in what happens when a market saturates. Battery capacity in ERCOT grew from 1,473 MWh in 2021 to 13,736 MWh in 2024, and batteries came to supply roughly three quarters of the system's ancillary service obligations in the evening peak. Prices followed the supply curve down.
McKinsey puts the average ERCOT ancillary service price at $21/MWh in 2023, $5/MWh in 2024 and about $3/MWh since. The system operator's own numbers tell the same story from the cost side: ancillary service costs in August 2024 totalled $36.6 million, against $809 million in August 2023, a fall of 95% (ERCOT commercial markets update).
Where regulation still pays
PJM runs the largest capacity and regulation markets in the country, and its regulation product has historically been priced high enough to carry a standalone battery. The catch is that PJM has also been the market most exposed to capacity price reform, which changes the revenue floor for everything in it. CAISO keeps a smaller regulation market alongside a much larger resource adequacy program, and most California batteries treat regulation as a secondary line rather than the base.
Capacity Payments and Resource Adequacy
Capacity revenue pays for being available, not for delivering energy. It is the most stable of the streams and the one that most often decides whether a project clears its debt covenants, because it can be contracted years ahead.
CAISO resource adequacy
California requires every load-serving entity to hold physical capacity against its peak, and storage qualifies. A four-hour battery can sell resource adequacy capacity forward, which turns a volatile merchant line into something a lender will accept. That is why 43% of CAISO capacity reports arbitrage as its primary use while the same assets also hold RA contracts: the EIA records one primary use, but the project earns from both.
PJM capacity market
PJM clears capacity in an auction rather than through bilateral contracts, and the clearing price sets a floor for every resource in the market. The constraint for storage is duration: a two-hour system can claim only a fraction of its nameplate, a four-hour system close to full value. Duration, not megawatts, is what gets paid here.
Renewable Firming and Contracted Revenue
Co-locating storage with solar or wind, or signing a firming contract with a generator, converts merchant risk into a fixed payment. The EIA records this as renewable integration when it is the primary use, and it does not appear in the published share table, which is one reason the published percentages do not sum neatly.
The contracted route has become more attractive as merchant revenue has fallen. Berkeley Lab's 2025 utility-scale solar data update puts the average price of a solar-plus-storage power purchase agreement at about $75/MWh in 2024 and 2025, up from a low near $40/MWh in 2021 and 2022, and reports that 47% of solar capacity in interconnection queues is paired with a battery.
For a developer, a $75/MWh contracted price is worth less than the same number earned merchant, because the contract transfers upside away. It is worth more to a lender, which is the trade being made.
A fifth stream, voltage and reactive support, pays a small amount for reactive power in the few markets that price it separately. It rarely carries a project on its own but can be stacked on top of the others. The five differ in what they pay for and how the price is set, and that difference, more than the headline numbers, decides which ones a given project can actually win.
Stream
What gets paid for
Pricing basis
Strongest in
Energy arbitrage
MWh moved from low-price to high-price hours
$/MWh of spread captured
CAISO, ERCOT
Frequency regulation
MW held ready and responding within seconds
$/MW-hour of availability plus a performance component
ERCOT, PJM, CAISO
Capacity and resource adequacy
MW available at system peak, dispatched or not
$/kW-month or $/kW-year, contracted forward
CAISO, PJM
Renewable firming
A contracted delivery shape from a paired plant
$/MWh under a power purchase agreement
CAISO, Southwest, ERCOT
Voltage and reactive support
Reactive power injected or absorbed locally
$/MVAr-hour, where a market exists
Limited and local
What the Revenue Adds Up To
Revenue per kilowatt is where the market story becomes concrete. ERCOT is the only major market where the numbers are published consistently enough to track year on year.
Market
CAISO
ERCOT
Battery capacity, end of 2024
11.7 GW
8.1 GW
Primarily used for arbitrage
43%
About 50%
Market design
Energy plus a separate resource adequacy program
Energy only, no capacity market
Dominant revenue in 2024
Arbitrage and resource adequacy
Arbitrage, with ancillary services fading
Revenue change since 2023
Down 32%
Down 71%
ERCOT, 2023 to 2024
The average ERCOT battery earned $182 per kW-year in 2023. In 2024 the average fell to $52, a drop of 71%. The best performer earned close to $300 in 2023 and $108 in 2024, so the gap between a well-run asset and an average one widened even as the average collapsed.
Behind that fall sits a simpler number. ERCOT's real-time hub average price in August 2024 was $39.70/MWh, against $221.59/MWh in August 2023. Mild weather and a lot of new supply removed most of the scarcity that batteries were being paid to relieve.
Average revenue fell 71% in a single year. The best performer still earned more than double the average.
What a 100 MW project looks like
At $52/kW-year a 100 MW battery in ERCOT grosses about $5.2 million a year; at 2023 prices the same asset grossed $18.2 million. With installed cost around $458/kWh in 2024, a 100 MW / 400 MWh system represents roughly $183 million of capital. A $5.2 million line does not service that, which is why the market moved toward capacity contracts, tolling and co-location.
This is the arithmetic that explains the EIA table. When merchant arbitrage pays $52/kW-year and a contracted capacity product pays a predictable amount for the same asset, developers build for the contract.
Why Revenue Falls as the Fleet Grows
Every revenue stream here is self-limiting. Arbitrage narrows spreads. Regulation collapses clearing prices. Capacity auctions clear lower when more supply bids in. Firming contracts get repriced once enough batteries compete for them. Growth in the fleet is, mechanically, a decline in the unit economics of the fleet.
There is no way around this except to earn from more than one stream at once. A battery that holds a resource adequacy contract, bids regulation in the hours when the spread is thin, and captures the evening ramp when it is wide will beat one that runs a fixed two-cycle day. The software doing that optimization is now a bigger determinant of project returns than the cells.
The Tax Credit and the Specification It Implies
Standalone storage has qualified for the investment tax credit since the Inflation Reduction Act, at a 30% base rate under sections 48 and 48E, with 10% uplifts for domestic content or energy community siting. Projects above 1 MW must meet prevailing wage and apprenticeship rules to claim the full rate; without them the credit falls to a fraction. The conditions sit in sections 48 and 48E of the Internal Revenue Code, and the prevailing wage and apprenticeship tests are the ones most projects trip over.
A 30%% credit cuts the capital that has to be recovered by roughly the same proportion, which is the difference between a project that clears its hurdle rate at $52/kW-year and one that does not. It also raises the value of availability, because the credit is claimed on capital and a system that spends less time offline earns more on the same capital.
For anyone specifying equipment rather than developing projects, the requirement that falls out of all this is short enough to list:
Round-trip efficiency high enough that a thin spread still clears after losses, since the marginal cycle is the one that decides annual revenue.
Cycle life long enough that daily cycling for fifteen years stays inside the warranty, not at its edge.
Four-hour duration wherever capacity is the anchor product, because that is what the capacity markets pay for.
Controls that accept dispatch signals from an optimizer, rather than a fixed daily schedule set at commissioning.
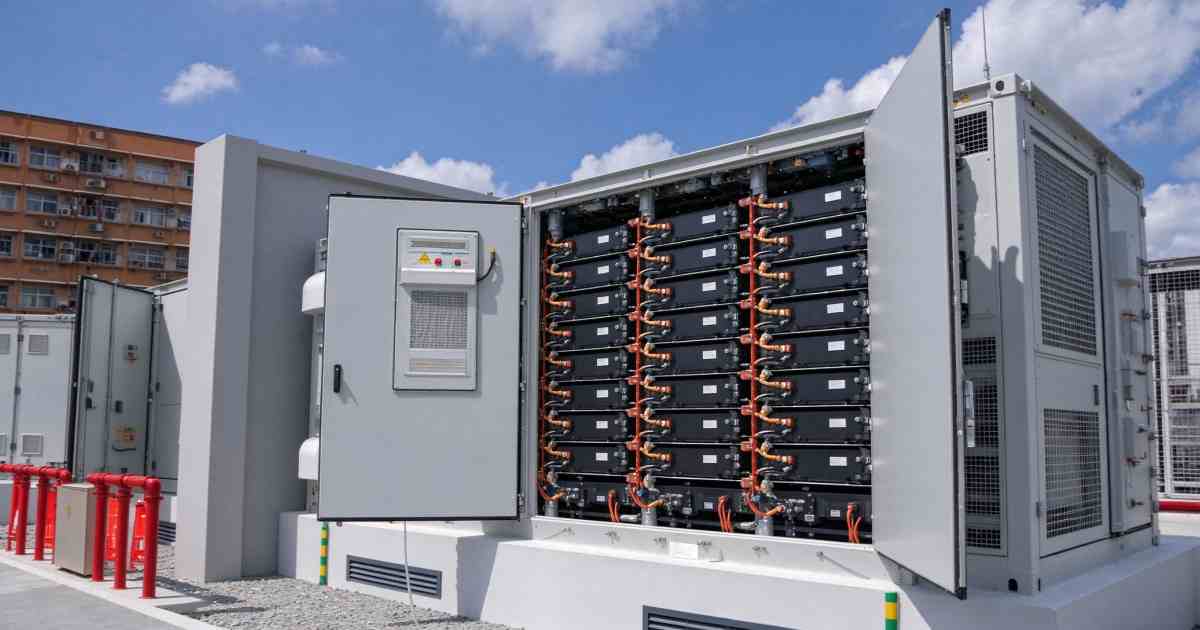
A system sized for one use case will underperform one sized for several. GreenMore builds containerized battery storage and liquid-cooled outdoor cabinets for commercial and larger distributed projects, and the specification conversation starts with which streams the project is meant to earn from. If you are working through that for a specific site, send us the market, duration and target revenue mix and we will tell you what we would check first.
Frequently Asked Questions
What is the main revenue stream for utility-scale battery storage in the US?
Energy arbitrage. In the 2024 EIA survey, 41% of utility-scale battery capacity reported arbitrage as its primary use, ahead of frequency regulation at 24%. A further 66% reported arbitrage among its uses, so most batteries earn from it even when it is not the main line.
Is arbitrage still growing?
No. Capacity primarily used for arbitrage was about 10.5 GW at the end of 2023 and about 10.7 GW at the end of 2024, while total capacity grew from 15.8 GW to 26 GW. Almost all of the 10.2 GW added in 2024 went to other uses.
Why did ERCOT battery revenue fall so much?
Average revenue fell from $182 per kW-year in 2023 to $52 in 2024. More battery capacity pushed ancillary service prices from $21/MWh to $5/MWh, and milder weather cut the August real-time average from $221.59/MWh to $39.70/MWh.
How much does a 100 MW battery earn?
In ERCOT at 2024 average rates, about $5.2 million a year before costs; at 2023 rates the same asset earned $18.2 million. Revenue varies widely by market, duration and how many services the asset stacks.
What is the difference between capacity and arbitrage revenue?
Arbitrage pays for energy moved between low-price and high-price hours. Capacity pays for being available at peak, dispatched or not, and is usually contracted forward. Capacity is the more bankable of the two, which is why four-hour duration commands a premium.
Does the investment tax credit apply to standalone storage?
Yes. Standalone storage qualifies for a 30% base investment tax credit under sections 48 and 48E, with 10% uplifts for domestic content or energy community siting. Projects above 1 MW must meet prevailing wage and apprenticeship rules for the full rate.
P
Peter Lu
Energy Storage Product Manager, GreenMore
Works with developers and commercial buyers on battery storage sizing for markets where revenue comes from more than one service. He follows EIA survey data and wholesale market outcomes to explain what arbitrage, regulation and capacity payments actually pay, and what that implies for duration, efficiency and cycle life in a specification.
Updated on November 16, 2026






 Network Supported


