How Solar Tiles Perform After 10,000 Days of Rain, Heat, Frost, and UV
Sep 18, 2026
These numbers come from the intersection of two engineering challenges: keeping solar cells producing electricity for three decades, and keeping a roof weathertight for just as long. When the same component has to do both, the environmental resilience requirements multiply.
The Degradation Problem Every Solar Owner Faces
All solar panels lose power over time. That's not a defect — it's physics. The question is how fast, and whether the rate is predictable enough to bank on for 25 or 30 years.
According to a 2024 NREL meta-analysis of degradation data spanning thousands of systems, the median annual degradation rate across all crystalline silicon modules is approximately 0.5–0.7% per year. That's the industry-wide average, including budget panels and premium ones, hot climates and cool ones.
But the average hides a wide spread. Premium glass-glass modules using N-type cell technology consistently show degradation rates in the 0.25–0.45% range. A study published in the Oxford Academic Clean Energy journal found that double-glass modules in hot-arid climates degraded at 0.3–0.4% per year, compared to 0.5–0.7% for glass-backsheet designs tested under the same conditions.
Here's what that gap means over the life of the system:
Degradation Scenario
Year 1 Loss
Annual Rate
Power at Year 10
Power at Year 25
Industry average (glass-backsheet)
2–3%
0.5–0.7%/yr
~93–94%
~80–84%
Double-glass (glass-glass)
1–1.5%
0.3–0.4%/yr
~96–97%
~88–91%
GreenMore tiled tiles (specified)
≤2%
≤0.45%/yr
~95%+
~87%+
The 7–10% gap at year 25 isn't just an efficiency difference. On a 10 kW residential system, it represents 10,000–15,000 kWh of additional lifetime energy production — enough to power an average European household for an extra year or two over the system's life.
Temperature Extremes: From Desert Noon to Arctic Dawn
The −40°C to +85°C operating range covers virtually every climate where buildings exist. But operating temperature and cell temperature are different things. On a 40°C summer day with full sun, rooftop cell temperatures routinely reach 65–75°C. In desert environments like the Middle East or North Africa, peak cell temperatures can exceed 80°C.
At those temperatures, every solar cell loses power. The rate of loss is defined by the temperature coefficient — typically −0.30% to −0.45%/°C for crystalline silicon. The key difference between technologies:
Cell Technology
Temperature Coefficient
Power Loss at 65°C
Polycrystalline (P-type)
−0.40 to −0.45%/°C
16–18%
Mono PERC (P-type)
−0.34 to −0.38%/°C
13.6–15.2%
BC Back-Contact (N-type)
−0.29 to −0.32%/°C
11.6–12.8%
GreenMore's BC back-contact technology line (added in 2025, up to 24.1% efficiency) uses N-type cells with a lower temperature coefficient, meaning less power loss during hot afternoons. For projects in hot climates, this difference compounds — a 4–6% annual energy advantage in places like the Middle East or Southeast Asia translates to real money saved over decades.
But temperature also affects the physical materials. Repeated thermal cycling causes differential expansion in materials that expand at different rates — in a glass-backsheet module, the glass front and polymer back create shear stress on the encapsulant and cell interconnects, contributing to microcracking over time. In a glass-glass structure, both faces expand at the same rate, eliminating this thermal mismatch. It's a primary reason double-glass modules show consistently lower degradation in field studies.
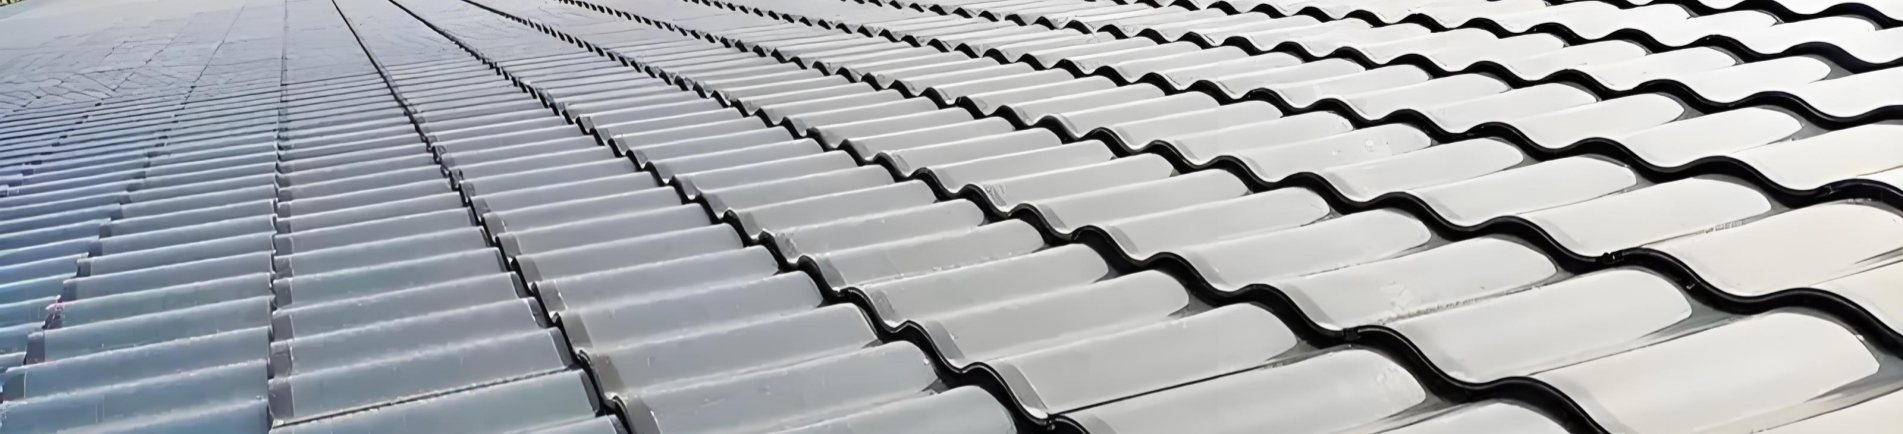
Multi-layer structure and weather resistance diagram of photovoltaic tiles
UV Exposure: The Invisible Degradation Mechanism
Ultraviolet radiation doesn't just affect power output — it attacks the physical materials of the module. Standard EVA encapsulant yellows under prolonged UV exposure, reducing light transmission to the cells. Polymer backsheets become brittle and develop microcracks. Anti-reflective coatings on low-quality modules deteriorate within 5–7 years in high-UV environments.
A 2025 study examining crystalline silicon modules after 13 years of desert exposure (Dhahran, Saudi Arabia — peak temperatures 45°C, UV index >11, irradiance >1000 W/m²) found 29.61% power loss in standard glass-backsheet modules, with encapsulant yellowing and frame corrosion as visible failure modes. The modules reached the 80% power threshold in 13 years, well short of the 25-year warranty expectation.
Glass doesn't yellow. It doesn't become brittle under UV exposure. And it doesn't allow UV radiation to reach the encapsulant layer in the same way that a thin polymer backsheet does. This is why double-glass modules in the same desert conditions typically show 2× better UV resistance in accelerated aging tests.
Climate-by-Climate Performance
Different climates stress different aspects of a solar tile's design. Hot-arid environments test UV stability and encapsulant integrity — the 2025 desert field study showed standard modules losing nearly 30% power in just 13 years under extreme conditions. Tropical coastal zones test moisture and salt resistance, where the glass-glass structure's near-zero permeability provides a clear advantage. Cold-continental climates stress freeze-thaw cycling and snow load capacity, where symmetrical thermal expansion matters most.
The IPCC Sixth Assessment Report documented that solar energy costs have fallen by up to 85% since 2010. But cost only matters if the system delivers expected energy over its lifetime. A solar roof tile that degrades 30% faster than projected in a hot climate is a bad investment regardless of how cheap it was to install.
GreenMore's own specifications — targeting 0.3–0.4% annual degradation for the double-glass structure — sit at the conservative end of what premium glass-glass technology delivers. The 30-year design life accounts for the full range of environmental stressors that a roof-integrated product faces, from UV degradation to thermal cycling to moisture exposure.
What This Means for Your 25-Year Energy Projection
When modeling the financial return of a solar roof installation, the degradation rate assumption has a larger impact than most people realize. A 0.3%/year assumption vs. a 0.7%/year assumption produces a 10%+ difference in cumulative energy production over 25 years.
For GreenMore's tiled type photovoltaic tiles, the combination of double-glass frameless construction, N-type BC back-contact cell technology (up to 24.1% efficiency), and a −40°C to +85°C operating range provides a platform for stable, predictable energy production across three decades and virtually any climate zone on Earth.
The full solar tiles product range includes multiple form factors for different architectural and climatic requirements, each sharing the same double-glass structural foundation. For project-specific energy modeling and climate-based product selection, GreenMore's technical team provides support through the customization and contact services on the company website.
Solar tiles that survive 30 years of weather without needing replacement aren't a hypothetical product concept. The material science — tempered glass on both faces, stable encapsulants, N-type cells with low temperature coefficients — has been validated by over a decade of field data. The question isn't whether glass-glass BIPV tiles can last. It's whether your project can afford the extra energy they'll produce along the way.





 Network Supported

