
Welcome to GreenMore
Welcome to GreenMore
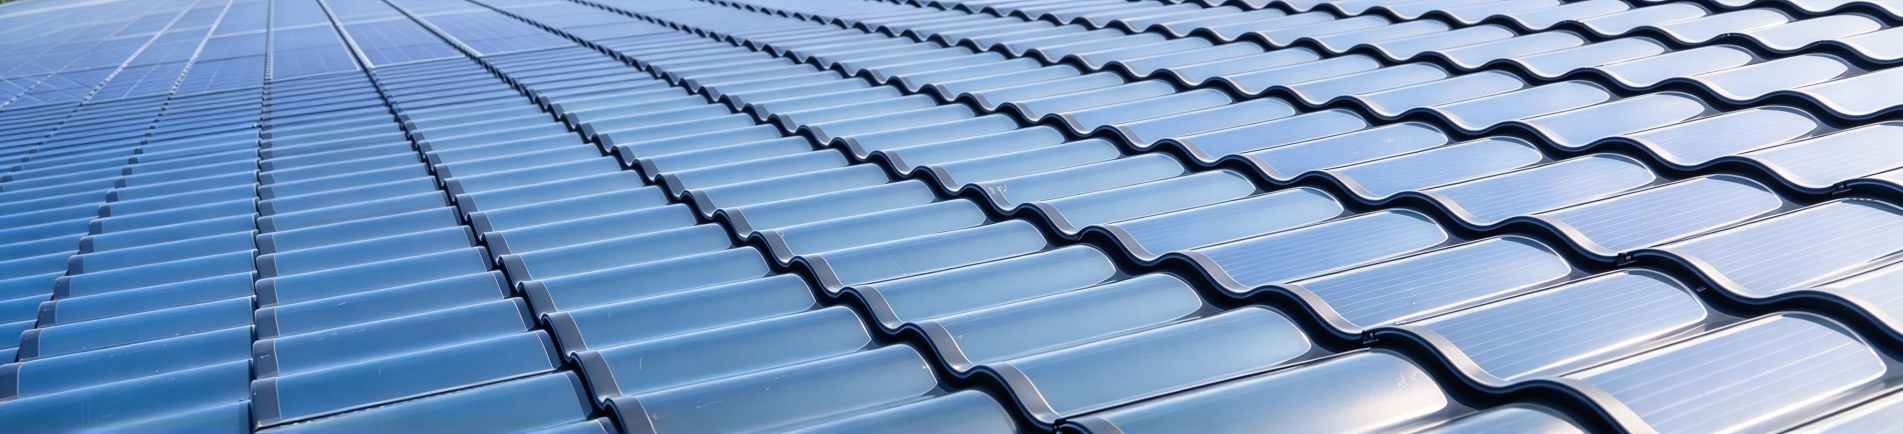
These numbers come from the intersection of two engineering challenges: keeping solar cells producing electricity for three decades, and keeping a roof weathertight for just as long. When the same component has to do both, the environmental resilience requirements multiply.
All solar panels lose power over time. That is not a defect, it is physics. The question is how fast, and whether the rate is predictable enough to bank on for 25 or 30 years.
The most useful public benchmark is NREL's 2024 PV Fleet analysis, which tracks 8.5 GW of real systems across 24,000 inverter channels. It puts median system-level performance loss at 0.5 to 0.75% per year, and finds that systems in the hottest climate zones lose roughly twice as much per year as those in cooler ones. That is the fleet average, budget hardware and premium hardware mixed together.
The average hides a wide spread, and the spread is where the money is. Premium glass-glass modules built on N-type cells are typically warranted at 0.25 to 0.45% per year, against 0.5 to 0.7% for conventional glass-backsheet designs. Some of that gap is cell technology and some of it is packaging, but both show up in the same place: how much of the original nameplate is still there in year 25.
| Degradation scenario | Year 1 loss | Annual rate | Power at year 10 | Power at year 25 |
|---|---|---|---|---|
| Industry average (glass-backsheet) | 2–3% | 0.5–0.7%/yr | ~91–94% | ~82–87% |
| Double-glass (glass-glass) | 1–1.5% | 0.3–0.4%/yr | ~95–96% | ~89–92% |
The 5 to 10 point gap at year 25 is not just an efficiency difference. On a 10 kW residential system generating around 12,000 kWh a year, it works out to roughly 12,000 to 13,000 kWh of additional lifetime production, about three to four years of an average European household's electricity.
GreenMore solar tiles are rated for an operating temperature range of −40 °C to +85 °C, which covers virtually every climate where buildings exist. But operating temperature and cell temperature are different things. On a 40 °C summer day with full sun, rooftop cell temperatures routinely reach 65–75 °C. In desert environments like the Middle East or North Africa, peak cell temperatures can exceed 80 °C.
At those temperatures, every solar cell loses power. The rate of loss is defined by the temperature coefficient, typically −0.29% to −0.45%/°C for crystalline silicon. The gap between technologies is not academic:
| Cell technology | Temperature coefficient | Power loss at 65 °C cell |
|---|---|---|
| Polycrystalline (P-type) | −0.40 to −0.45%/°C | 16–18% |
| Mono PERC (P-type) | −0.34 to −0.38%/°C | 13.6–15.2% |
| N-type (TOPCon or back-contact) | −0.29 to −0.32%/°C | 11.6–12.8% |
GreenMore's tiled type photovoltaic tiles are specified at −0.290%/°C, which puts them in the N-type column. The company added a separate back-contact product line in 2025, reaching up to 24.1% module efficiency on a curved tile format. For projects in hot climates, the difference against a −0.40%/°C module compounds through the year: an average cell temperature 25–30 °C above STC turns a 0.11%/°C advantage into roughly 2–3% more annual energy. Over a decade in the Middle East or Southeast Asia, that is real money.
Temperature also affects the physical materials. Repeated thermal cycling causes differential expansion in materials that expand at different rates. In a glass-backsheet module, the glass front and polymer back create shear stress on the encapsulant and cell interconnects, contributing to microcracking over time. In a glass-glass structure, both faces expand at the same rate, so the laminate moves as one body. It is a primary reason double-glass modules hold up better in field studies, and it is why the packaging, not just the cell, decides how a roof tile behaves in year 20.
Ultraviolet radiation does not just affect power output, it attacks the physical materials of the module. Standard EVA encapsulant yellows under prolonged UV exposure, reducing light transmission to the cells. Polymer backsheets become brittle and develop microcracks. Anti-reflective coatings on low-quality modules deteriorate within 5 to 7 years in high-UV environments.
A 2025 field study followed a crystalline silicon module through 13 years of desert exposure at Dhahran, Saudi Arabia, where ambient temperatures reach 45 °C, the UV index climbs above 11 in peak months and irradiance exceeds 1,000 W/m². The measured result was a 29.61% drop in maximum power, with encapsulant yellowing and frame corrosion as the visible failure modes. The module crossed the 80% threshold in year 13, well short of the 25-year warranty it was sold under.
Read that carefully, because it is a single module in one of the harshest sites on earth, not a verdict on the technology. What it does show is the failure mode: the cells were largely intact, the packaging was not. Electroluminescence imaging found inactive regions from microcracks and interconnect failures, and the fill factor had fallen to 58.86%. The power loss came from the module losing its ability to move current, not from the silicon wearing out.
Glass does not yellow. It does not become brittle under UV exposure. And it does not let UV radiation reach the encapsulant the way a thin polymer backsheet does, because there is no thin polymer backsheet. That removes the two failure channels the Dhahran module failed on: backsheet embrittlement and the moisture path that lets acetic acid build up around the cells. Double-glass modules still age, but they age through slower mechanisms.
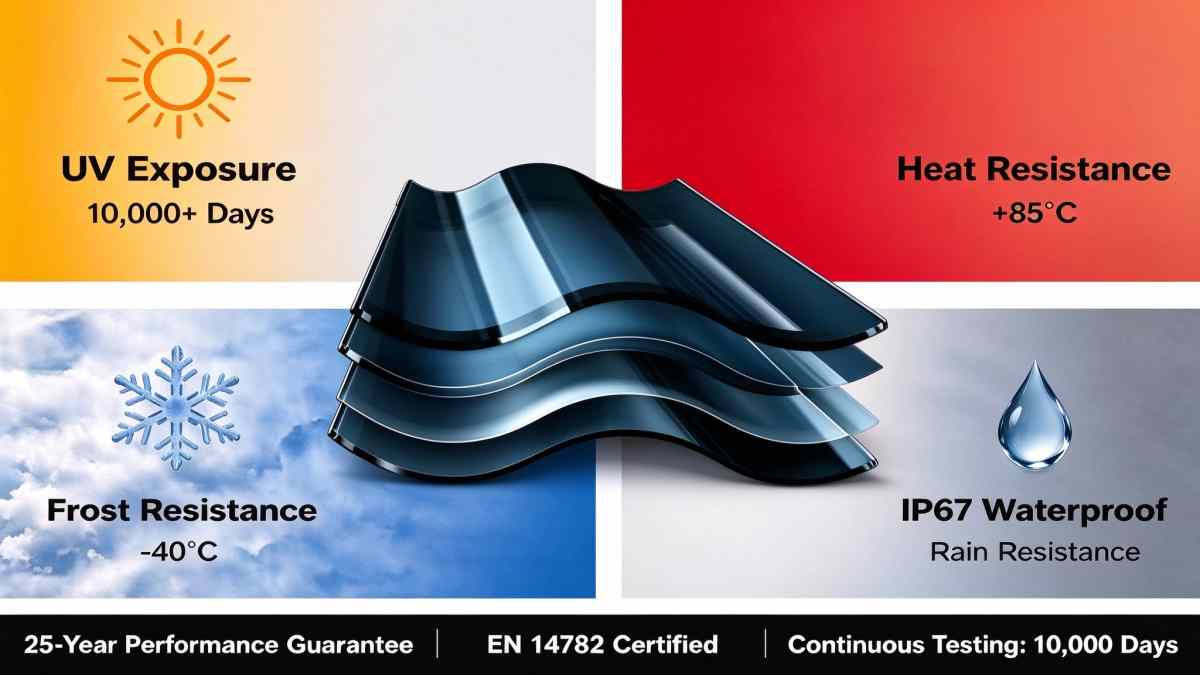
The three stress categories a roof-integrated module has to survive at once.
Different climates stress different aspects of a solar tile's design, and a specification that looks strong on a European datasheet can be the wrong choice in a Gulf summer.
Hot-arid environments test UV stability and encapsulant integrity. The Dhahran study is the extreme case: standard modules losing nearly 30% of rated power in 13 years. The design response is glass on both faces, a UV-stable encapsulant and a low temperature coefficient, in that order of importance.
Tropical coastal zones test moisture and salt resistance. Glass has near-zero permeability, so the laminate itself does not admit water vapour the way a polymer backsheet does. The remaining risk sits at the edges and the junction box, which is why the connector and box ratings matter as much as the laminate in these projects.
Cold-continental climates stress freeze-thaw cycling and snow load. Symmetrical thermal expansion matters most here, and so does mechanical rating: GreenMore tiles carry a 5,400 Pa front-side static load, which is the number to check against your local snow load rather than a generic "heavy duty" claim.
The IPCC Sixth Assessment Report documented that unit costs of solar energy fell 85% between 2010 and 2019. Cheap modules are not the problem. Cheap modules that degrade 30% faster than projected in a hot climate are, because the cost saving is paid back in lost generation for the next two decades.
When modeling the financial return of a solar roof, the degradation assumption has a larger impact than most people realize, but not always in the direction they expect. A 0.3%/year assumption against a 0.7%/year assumption puts year-25 output about 9 percentage points apart. Cumulative production over 25 years differs by roughly 5%, because the early years, where both curves are close, carry the most kWh.
That is the honest way to model it. The degradation rate matters most in the back half of the asset life, which is exactly when a roof-integrated product is hardest to replace, and least in the years when the financial model is most sensitive. Both numbers belong in the spreadsheet.
For GreenMore's tiled type photovoltaic tiles, the combination of monocrystalline double-glass frameless construction and a −40 °C to +85 °C operating range provides a platform for stable, predictable production across three decades and virtually any climate zone. Every tile carries a 25-year linear power warranty against a 30-year design life. Projects that specifically require N-type back-contact cells, up to 24.1% module efficiency, can select them from GreenMore's curved BC solar tile line.
Solar tiles that survive 30 years of weather without needing replacement are not a hypothetical product concept. The material science, tempered glass on both faces, stable encapsulants and cells with low temperature coefficients, has been validated by more than a decade of field data. The question is not whether glass-glass BIPV tiles can last. It is whether your project can afford the extra energy they will produce along the way.
The published warranty curves say yes, and the reason is packaging rather than cells. A glass-backsheet module has two failure channels a double-glass module does not: the polymer backsheet embrittles and cracks under UV, and it transmits water vapour slowly enough that acetic acid accumulates around the cells. Remove the backsheet and both channels close. The Dhahran study is instructive here, because the module lost 29.61% of its power in 13 years while its cells were still largely functional. The packaging failed first.
Ask for −0.29 to −0.32%/°C, which is what N-type cells deliver, and treat anything above −0.38%/°C as a red flag for desert or tropical projects. At a 65 °C cell temperature the difference between −0.29 and −0.40 is about 4.4 percentage points of output at the exact moment your load is peaking. That gap shows up every afternoon for 25 years.
The warranty is a contractual floor: if output falls below the guaranteed curve before year 25, the manufacturer owes you a remedy. The design life is an engineering estimate of how long the product will keep working, not a promise of performance. GreenMore states both, 30 years designed and 25 years warranted, and the five-year gap is deliberate. It is the margin between what the materials should do and what the company is willing to put in writing.
Less than most sales decks imply, and more than most spreadsheets assume. Moving from 0.7% to 0.3% per year changes year-25 output by about 9 percentage points but cumulative 25-year production by only around 5%, because the two curves are nearly identical in the first decade. If a proposal shows a large lifetime energy difference from a small degradation change, check which years the difference is being taken from.
IEC 61215 cycles the module between −40 °C and +85 °C, the same window GreenMore rates its tiles for, and repeats it enough times to expose differential expansion problems. What it catches is delamination, solder joint fatigue and cracked interconnects. What it does not catch is long-term encapsulant yellowing, which is a UV dose problem rather than a temperature one. Both tests matter, and a datasheet that only cites one of them is telling you half the story.
If you are comparing tile options for a project in a hot, coastal or cold-continental climate, the specification you need differs in each case. Send us the site location, the roof pitch and your snow or wind load, and we will tell you which GreenMore tile fits and what degradation curve to model. Talk to our team before the energy model is locked.
Luke helps distributors and EPC contractors choose the right GreenMore tile for each climate, from hot-arid UV exposure to cold-continental freeze-thaw cycles. He reviews degradation assumptions, temperature coefficients and mounting configurations before a project is quoted, so 25-year energy projections are built on realistic field data rather than best-case figures.
Updated on November 12, 2026
Stay up to date with GreenMore. We share new BIPV solar tile releases, product and certification updates, and field notes from our projects — no fluff, just the things that matter to installers, distributors, and system integrators. If there's something you'd like to see covered, drop us a line — we read every reply.




Copyright @ 2026 GreenMore All Rights Reserved.  Network Supported
Sitemap / Blog / Xml / Privacy Policy


